Hopefully you’ll have Google Analytics set up to monitor your website. If you don’t, please create and account and get this set up immediately! Google Analytics is by far the most widely used solution for getting information and statistics about your website. When set up and used correctly, it provides you with the most powerful information to understand your website visitors and to help you continually improve all your marketing efforts for generating leads and sales.
Analytics provides you with information about how users are interacting with your website, and can help you to find opportunities both online and offline. One of the first questions you may be asked when proposing a new marketing activity will be ‘how can we measure the return on investment?’ – well Google Analytics can give you this information for your website as well as as a lot of other marketing efforts.
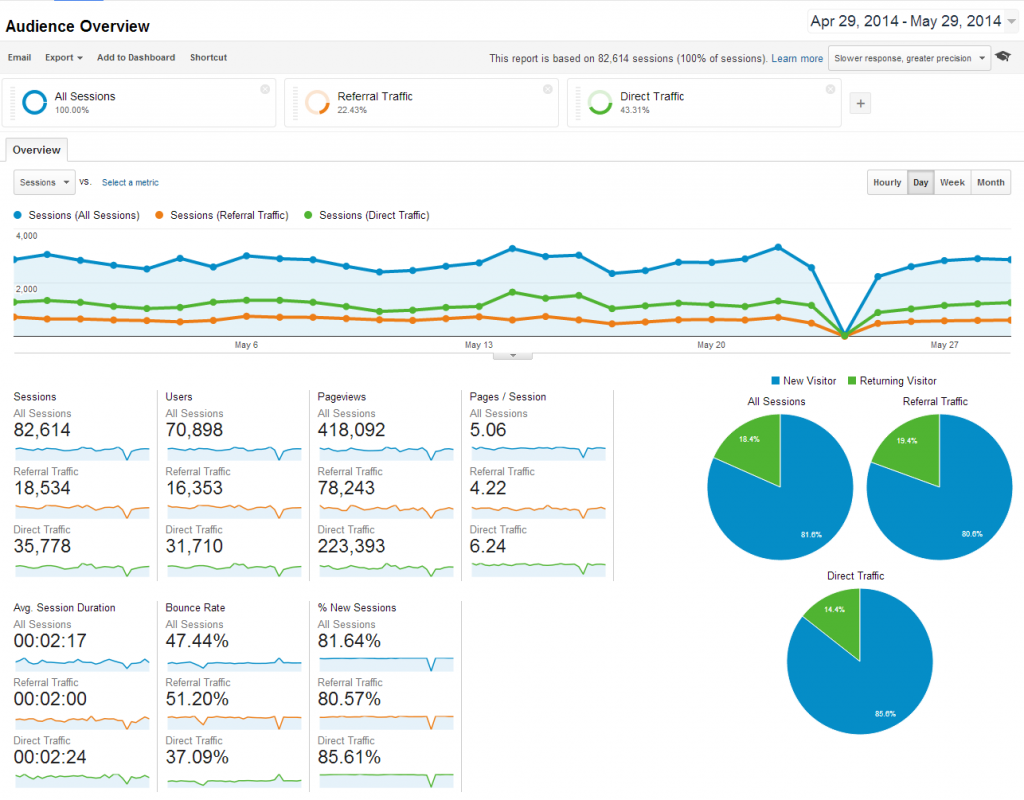
Below are three of our questions that Google Analytics can answer, all from the one Audience Overview report.
The Audience Overview report is the report that Google Analytics presents you with when you first log in. So it makes sense to understand what it shows you and how you can use the valuable data it provides.
You can segment your visitors data based on a range of different variables, and really get to grips with the different types of visitor to your website and how they interact with it.
1. Which towns are visitors to my website coming from
And which towns aren’t. If you’re focusing on working with your local community you’d hope to see a lot of visitors coming from the town from where you work. Likewise if you’ve got some geographically targeted advertising campaigns going, you’d want to see visitors from those towns too. By understanding where incoming traffic is coming from you can better link your offline and online marketing tactics. You can also see opportunities for expansion and growth in new locations.
Use the demographics section to see a full breakdown of traffic by country and city.
2. Which visitors are the most valuable for my marketing efforts
Are the visitors that arrive through your online marketing channels more or less engaged than those who find your website organically? How likely are each of them to visit your contact page, complete the contact form or complete a purchase? By segmenting sessions that users have had on your website by these categories, you can quickly find trends in terms of what visitors are the most valuable. This is useful when trying to determine where your marketing budget should be spent, as well as troubleshooting why certain visitors or marketing campaigns aren’t providing as much value as others.
3. Which browsers and devices are most used to access your website?
It’s important to know what your visitors are using to access your website. It’s vital that you have a mobile friendly website. It’s estimated that as much as 30% of all visitors are now accessing the web via mobiles or tablets, but this report can tell you the exact breakdown of what percentage you’re experiencing and exactly what kind of mobile or tablet your visitors are using.
The mobile section of the Audience Overview report will show you all this data. Within this same report you can also segment your traffic to show you how engaged users are with your website based on the devices they used to access it.
There’s a lot of data to consume in Google Analytics, not all of if will be important to you. However it’s important that you understand how to access the data you need and how to interpret it into useful, actionable marketing activities.
- How to Do Keyword Research for Google Ads - January 15, 2024
- A Comprehensive Guide to Google Ads for B2C Businesses - January 8, 2024
- How to Write Calls to Action (CTAs) for Google Ads - December 25, 2023


